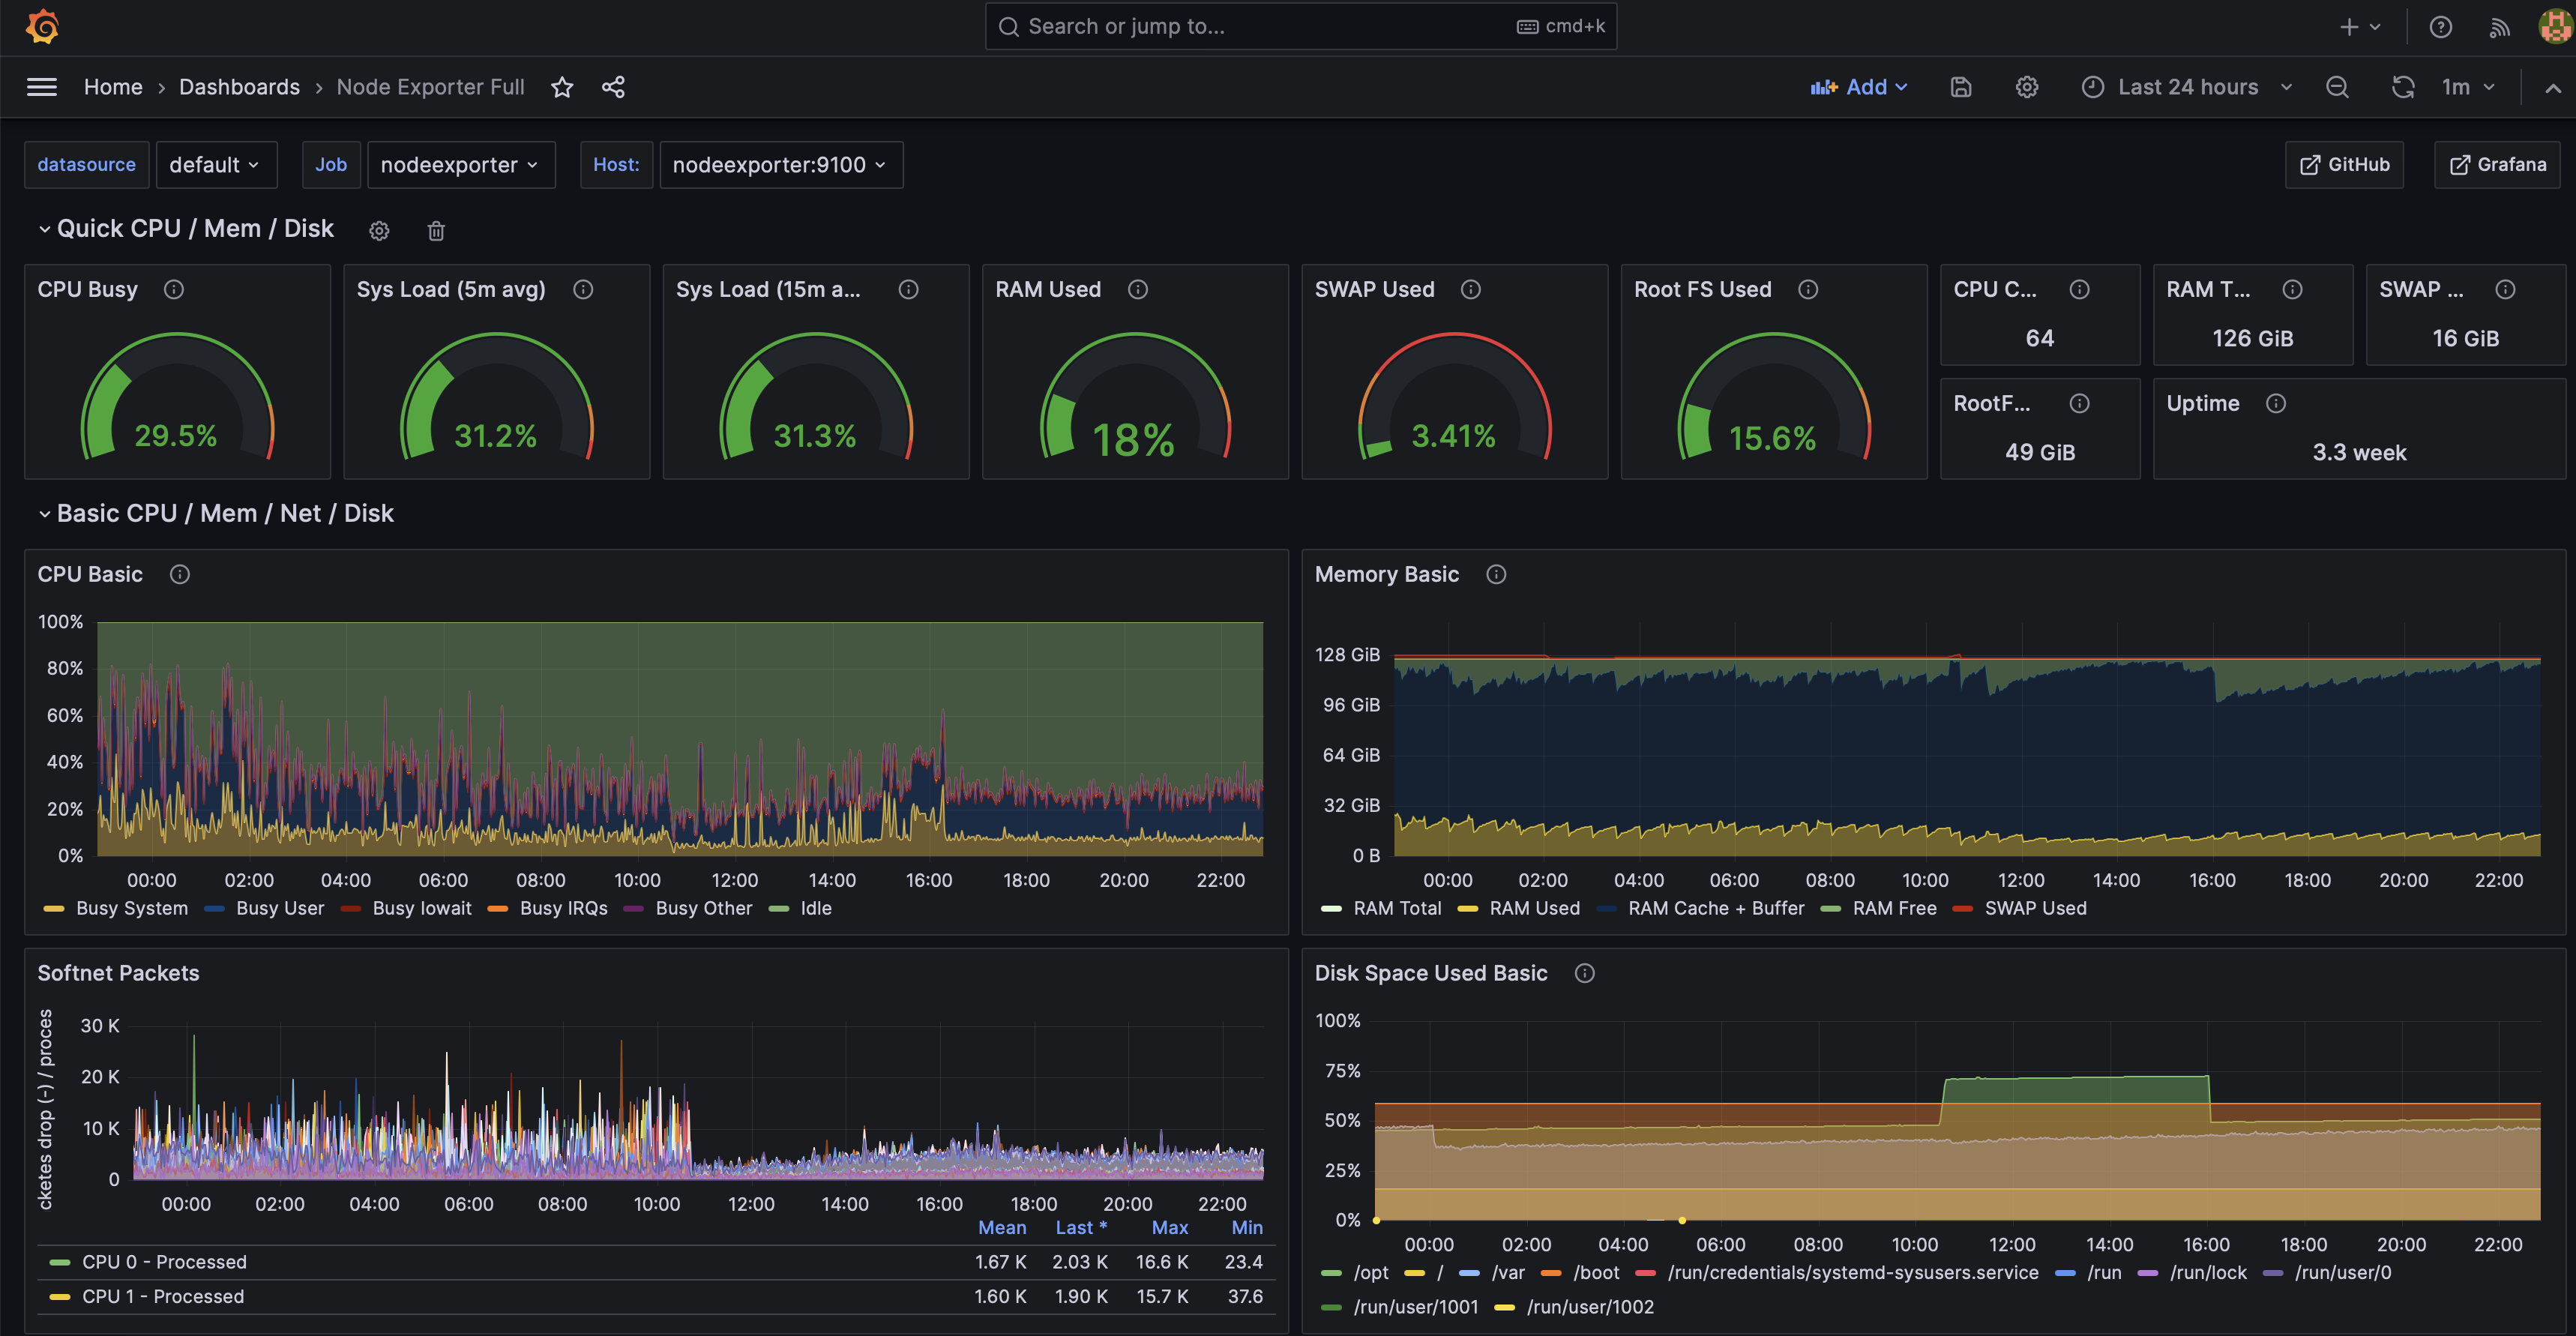
For those who find it interesting, enjoy!
This Community is intended for posts about the Lemmy.world server by the admins.
For support with issues at Lemmy.world, go to the Lemmy.world Support community.
Any support requests are best sent to info@lemmy.world e-mail.
If you would like to make a donation to support the cost of running this platform, please do so at the following donation URLs.
If you can, please use / switch to Ko-Fi, it has the lowest fees for us
For those who find it interesting, enjoy!
Great stats. Thanks for posting!
Always fun to see system dashboards.
I was hoping to see some uptime, but thanks for the window into your server! Are you still having to kill the instance every half hour?
Quite a beefy setup 😄
Thanks for all the hard work. It has been running so well all day!
I notice your defederation list is completely depopulated today. Is that intentional?
No it's just moved to the bottom of the page apparently. I preferred it on the side. Maybe a tab would be better.
I fucking love a sexy Grafana dashboard.
The entire team is doing an amazing job. Lemmy is getting smoother with each passing day. I hope it keeps growing (and none of you get too burnt out in the process)!
Ahh look at all those nice charts and diagrams, that's true server porn lol.
Again thank you very much for your awesome job. We all really appreciate that <3
THE DROP???!! >:O
Seriously! Talk about amazing optimization and debugging of the network service.
So I‘m currently on planning to host an instance myself. This graph helped me quite a lot to get an idea what system resources are required.
Do you use any reverse proxy in front of it?
Lemmy world has a lot of users. So your instance initially will require a lot less resources ✌️
Such pretty gobbledygook!
🤤
I think you can export the dashboard the way it looks to you - into Grafana cloud. Like a snapshot. Click "Share" then "upload" and share the link.
We won't be able to see historical data as it takes only dashboard snapshot with visible data.
Would be cool, isn't it?
This is indeed interesting, thanks again for the service!
Nice! That's a nice-looking dashboard, would you mind sharing its JSON config? Thanks!
it's the popular one on grafana.com - https://grafana.com/grafana/dashboards/1860-node-exporter-full/