this post was submitted on 30 Mar 2026
151 points (96.9% liked)
Climate
8483 readers
395 users here now
Discussion of climate, how it is changing, activism around that, the politics, and the energy systems change we need in order to stabilize things.
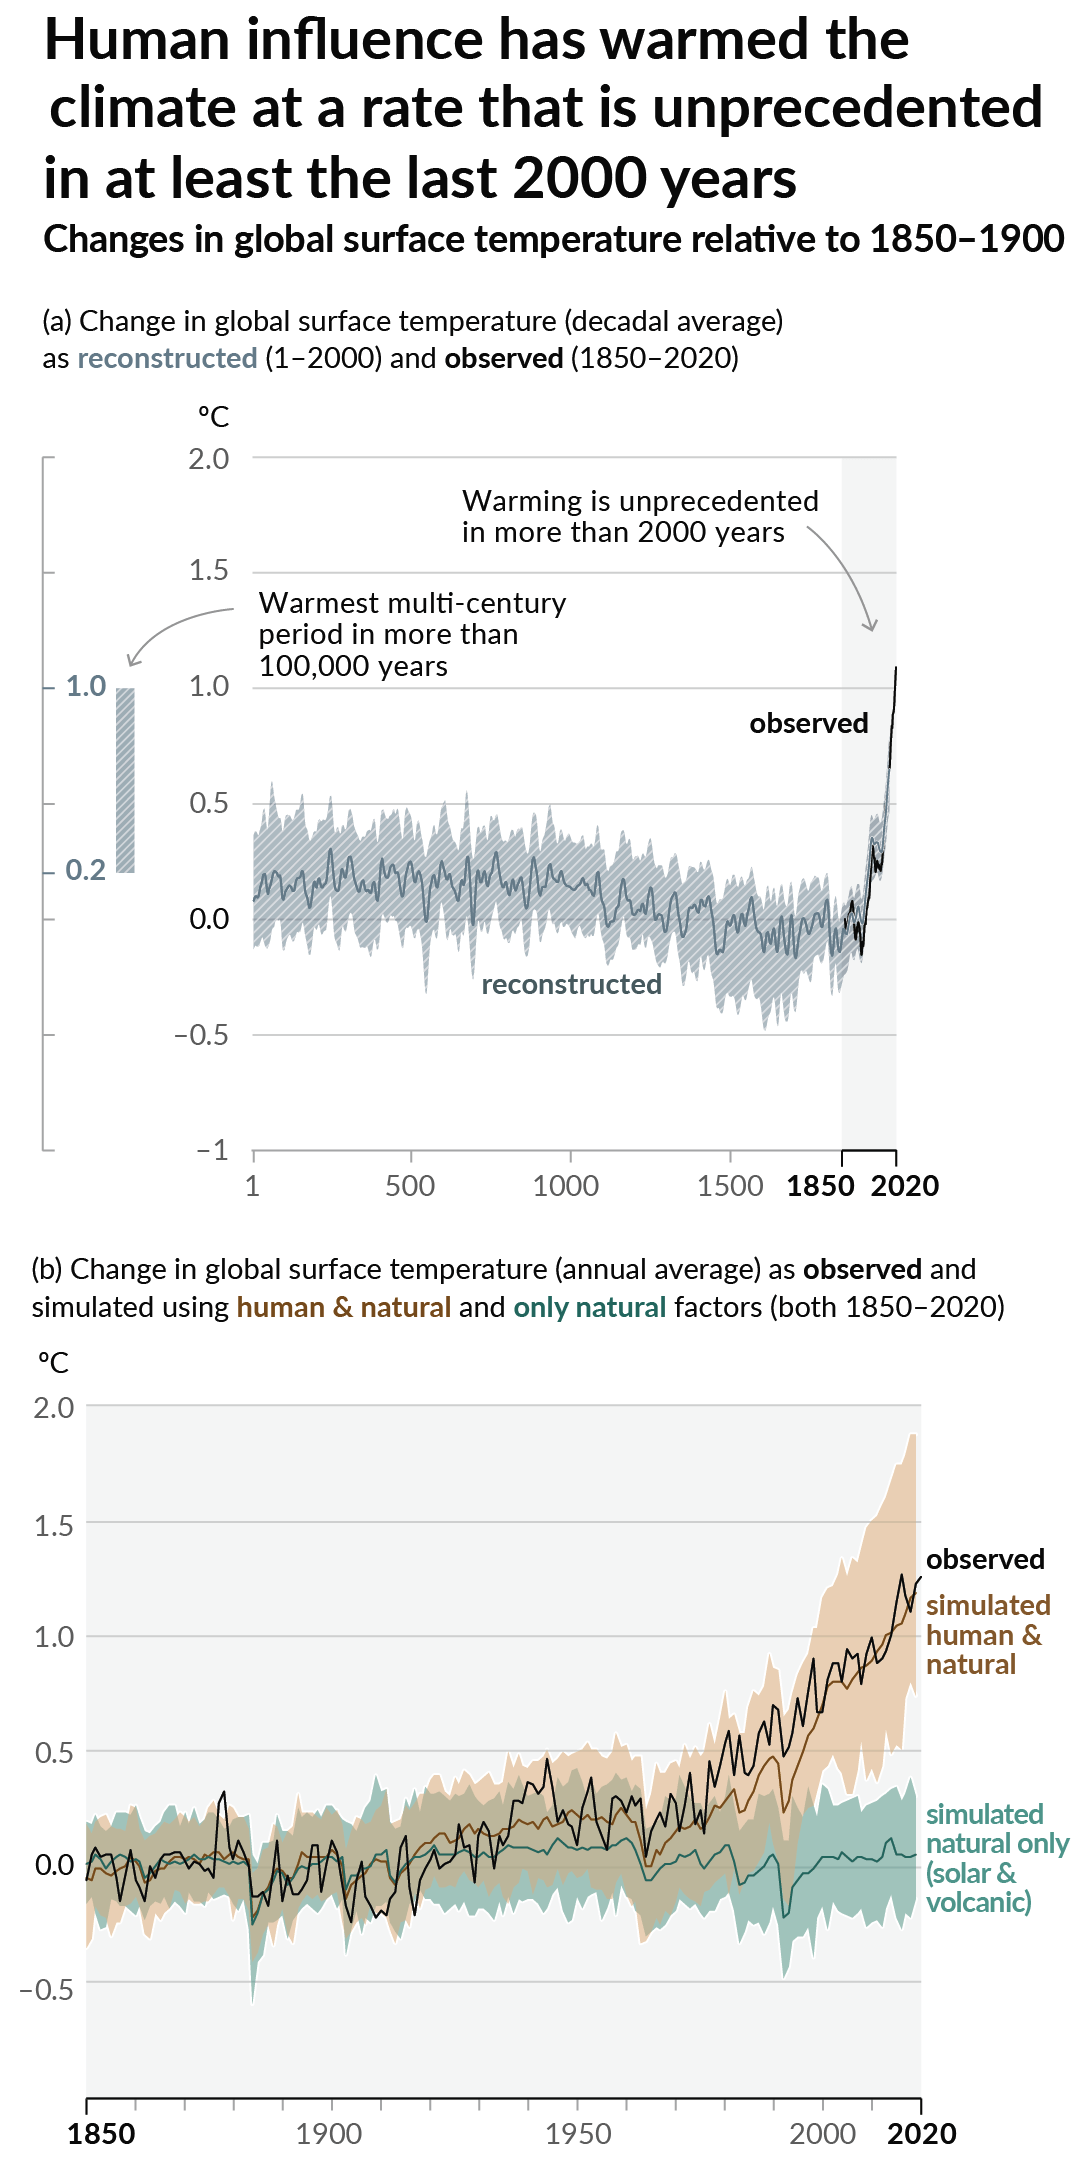
As a starting point, the burning of fossil fuels, and to a lesser extent deforestation and release of methane are responsible for the warming in recent decades:
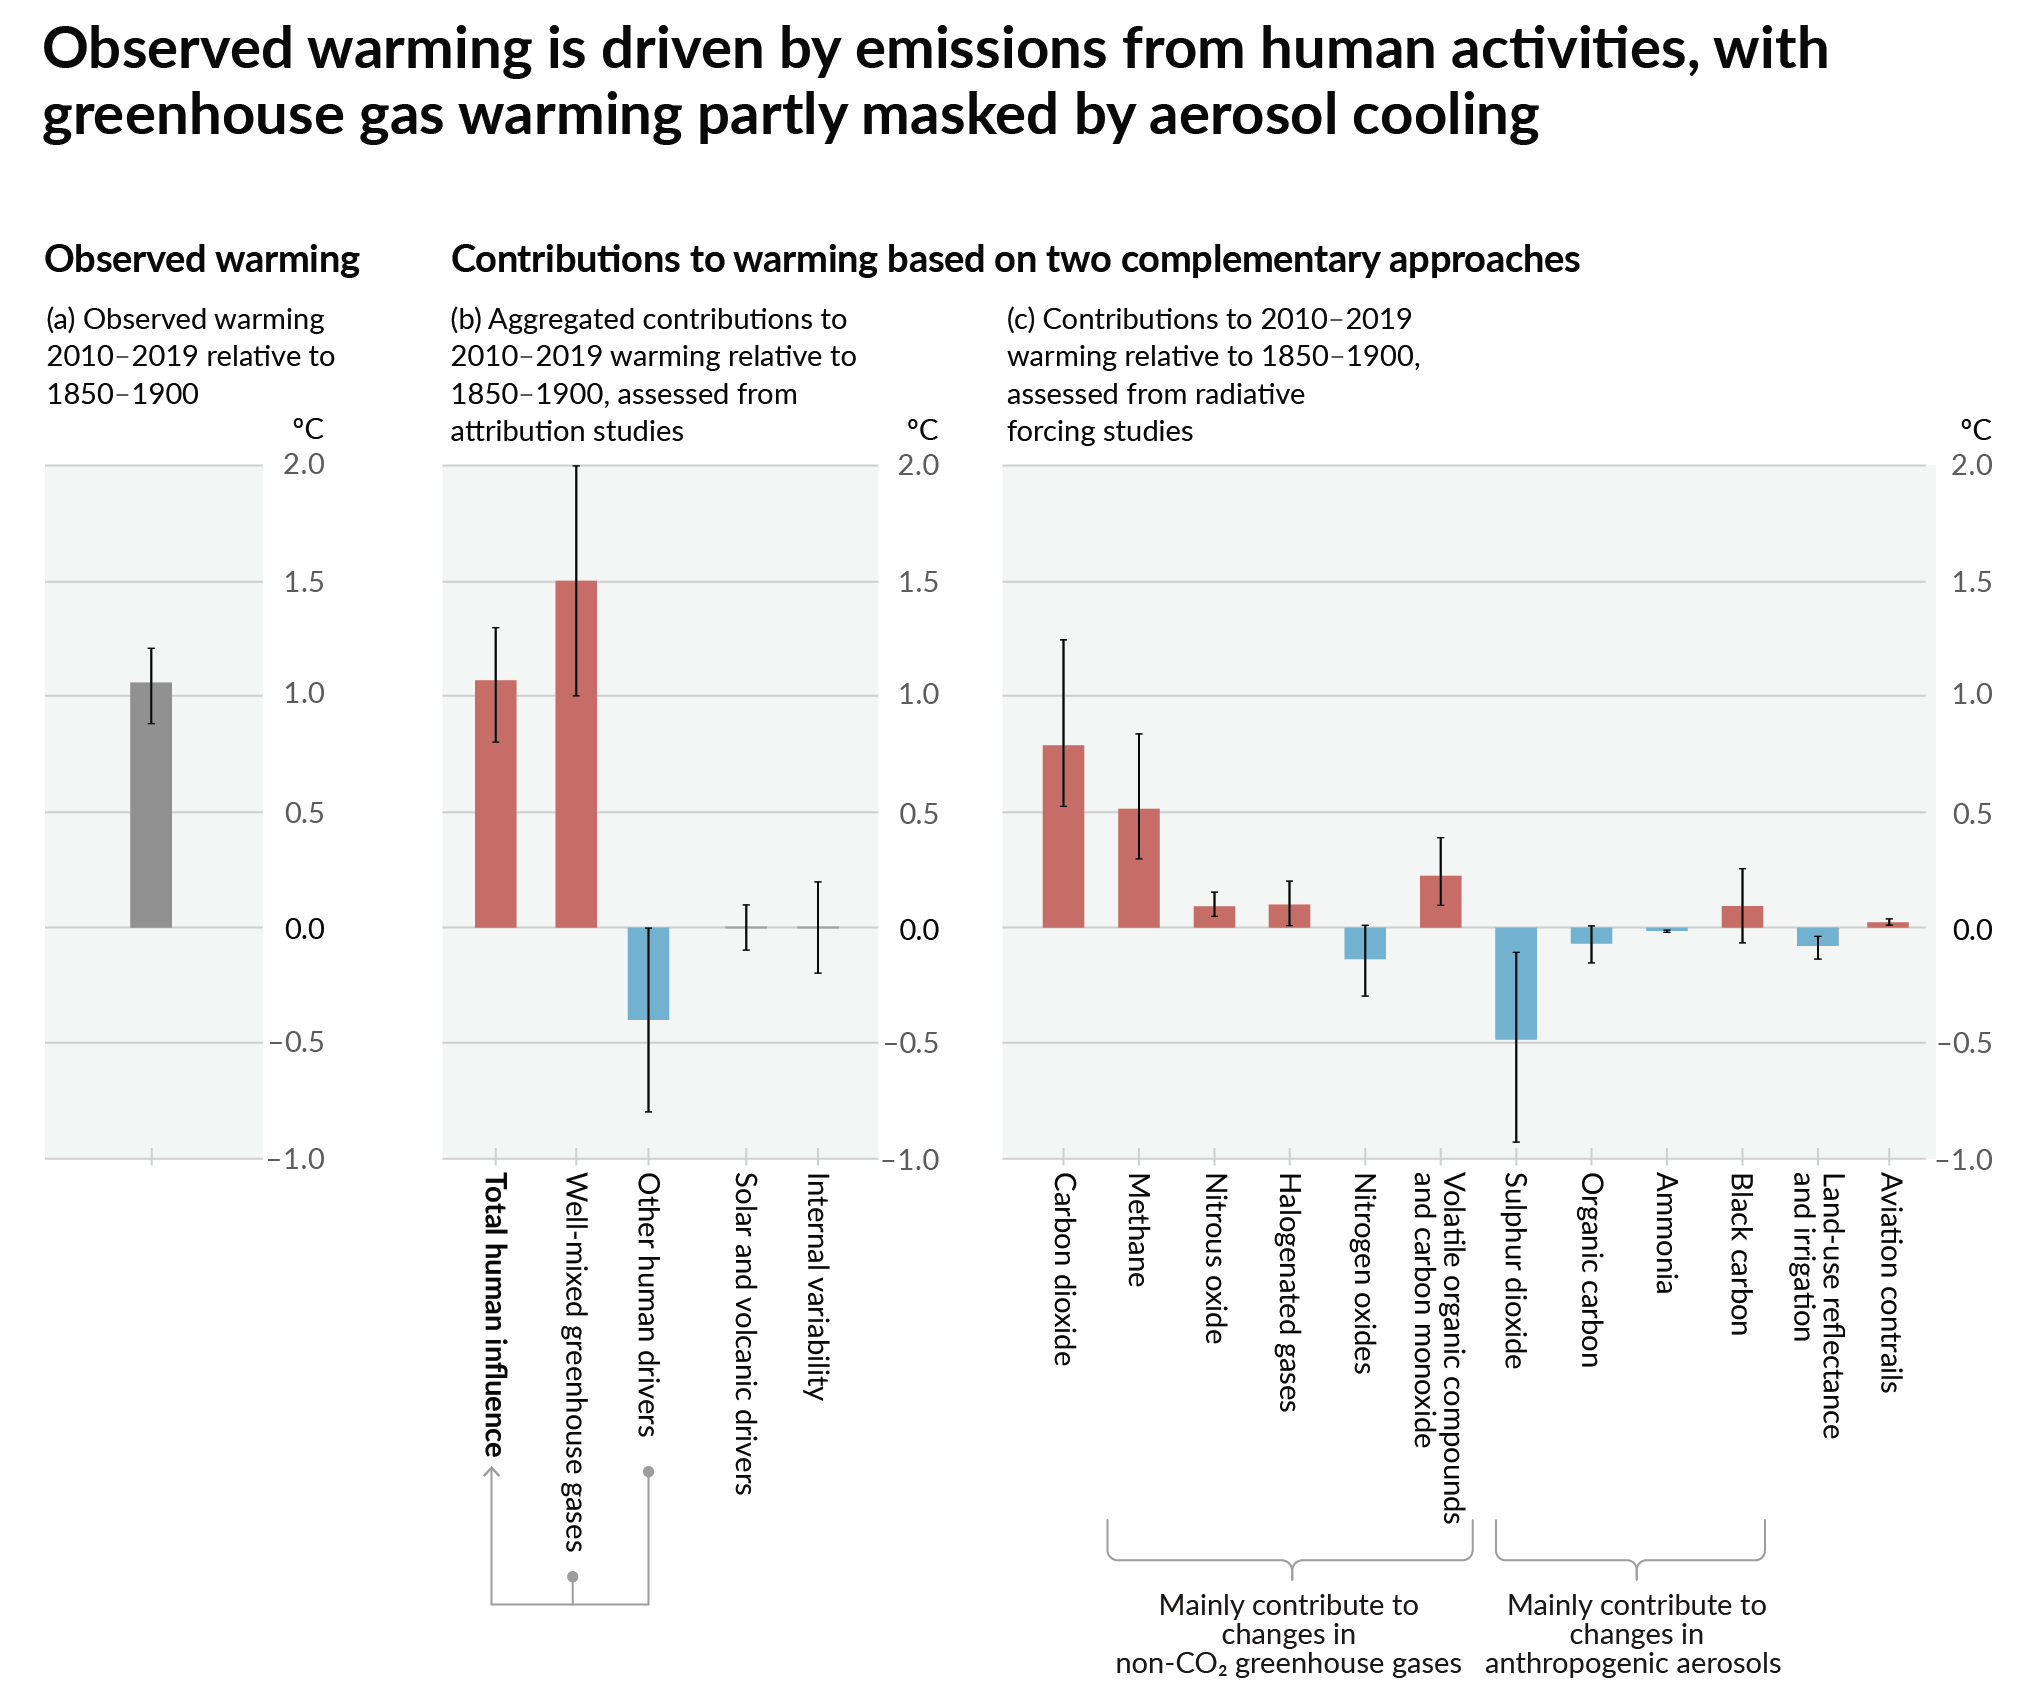
How much each change to the atmosphere has warmed the world:
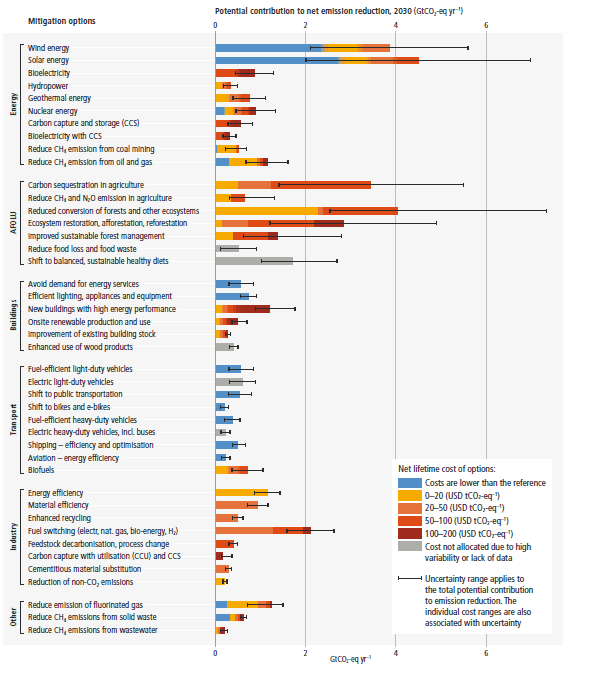
Recommended actions to cut greenhouse gas emissions in the near future:
Anti-science, inactivism, and unsupported conspiracy theories are not ok here.
founded 2 years ago
MODERATORS
you are viewing a single comment's thread
view the rest of the comments
view the rest of the comments
This study is crap.
No statistical significance, control groups, numbers, or models. Just rolling average temperature vs temperature.
They don’t say how they filter out trends or seasonality. They don’t look at switch point models or do difference in difference. And it’s a non reviewed preprint.
This research needs an actual statistician to use their data and fix it, because as is, this is not worth seriously discussing.
Edit: okay downvotes. I’m not saying there isn’t something here, I’m saying this study does nothing to support the hypothesis seriously.
We have data picking and choosing to throw out data, we have no statistical rigour, and we have no comparison against other rural land transformation activities.
We already know about urban heat islands, is this just that? That’s an important question when trying to say data center use is the issue.
It probably is an issue, the chart is compelling, but without better work none of this is actionable.
Dude, it's just a single downvote. It wasn't even made by anyone who bothered to make their own comment in the thread.
This study itself is bad, but it arguably promotes better studies to come out and nobody is doubting that AI data centers are just huge sources of heat radiation and energy consumption. The study you want takes time, effort, and will undoubtedly receive pushback . At the very least, it gave an excuse for CNN to talk about the issue.
Chart?
If you click though to the study instead of reading the drivel summarizing it for profit they have two graphics about time to data center and temperature.
https://www.researchgate.net/publication/403073048_The_data_heat_island_effect_quantifying_the_impact_of_AI_data_centers_in_a_warming_world/fulltext/69c21ebcac3812287560e46e/The-data-heat-island-effect-quantifying-the-impact-of-AI-data-centers-in-a-warming-world.pdf?origin=publication_detail&_tp=eyJjb250ZXh0Ijp7ImZpcnN0UGFnZSI6InB1YmxpY2F0aW9uIiwicGFnZSI6InB1YmxpY2F0aW9uRG93bmxvYWQiLCJwcmV2aW91c1BhZ2UiOiJwdWJsaWNhdGlvbiJ9fQ
That.. Is consistent
I wonder if there were trees or shade something in the before and direct sun in the after
And that’s why I want to see someone else take their data and do this justice